
Executive Healthcare Intelligence
Before you make another multimillion-dollar healthcare decision, establish what the numbers actually say.
An independent, evidence-based analysis of your health plan — advisor-led, powered by BenefitProof. We work from your own documents, separate fact from assumption, and give you decision-grade intelligence before you sign anything.
The questions the analysis answers
You’re asked to approve, not to examine
— one of your largest line items, decided from a summary, with everyone selling something.
- 01/05What are we spending?
- 02/05What does the evidence show?
- 03/05What deserves investigation?
- 04/05What could the opportunity be?
- 05/05What should management do next?
Year-round
It’s always the season to audit your healthcare spend.
Healthcare is one of your largest expenses in every month of the year — not just at renewal. The evidence that shows what it’s actually doing is already in your documents. Examine it early and you decide on your timeline, not the carrier’s deadline.
- Establish the evidence before a renewal is imminent.
- Findings can surface issues worth investigating at any point in the year.
- Waiting until renewal compresses every decision into a few weeks.
- Renewal is an important decision moment — not the definition of the work.
Aggregates hide the drivers
The number on the invoice hides the story.
A small share of claims and services typically drives the majority of healthcare cost. A plan summary shows you the total — not the drivers. BenefitProof reads the evidence to find them.
62.8%
of paid claims came from the top 5% of claimants
81.9%
came from the top 20%
| Claimants | Cumulative share |
|---|---|
| Top 5% (2) | 62.8% |
| Top 20% (8) | 81.9% |
| Top 50% | 96.9% |
The engagement
What the engagement delivers
- establish what the numbers say
- separate documented facts from assumptions
- identify evidence-supported opportunities
- investigate strategic alternatives
- evaluate competing solutions on the same terms
- executive-level decision intelligence
Proof
Facts on file, before a single change is proposed.
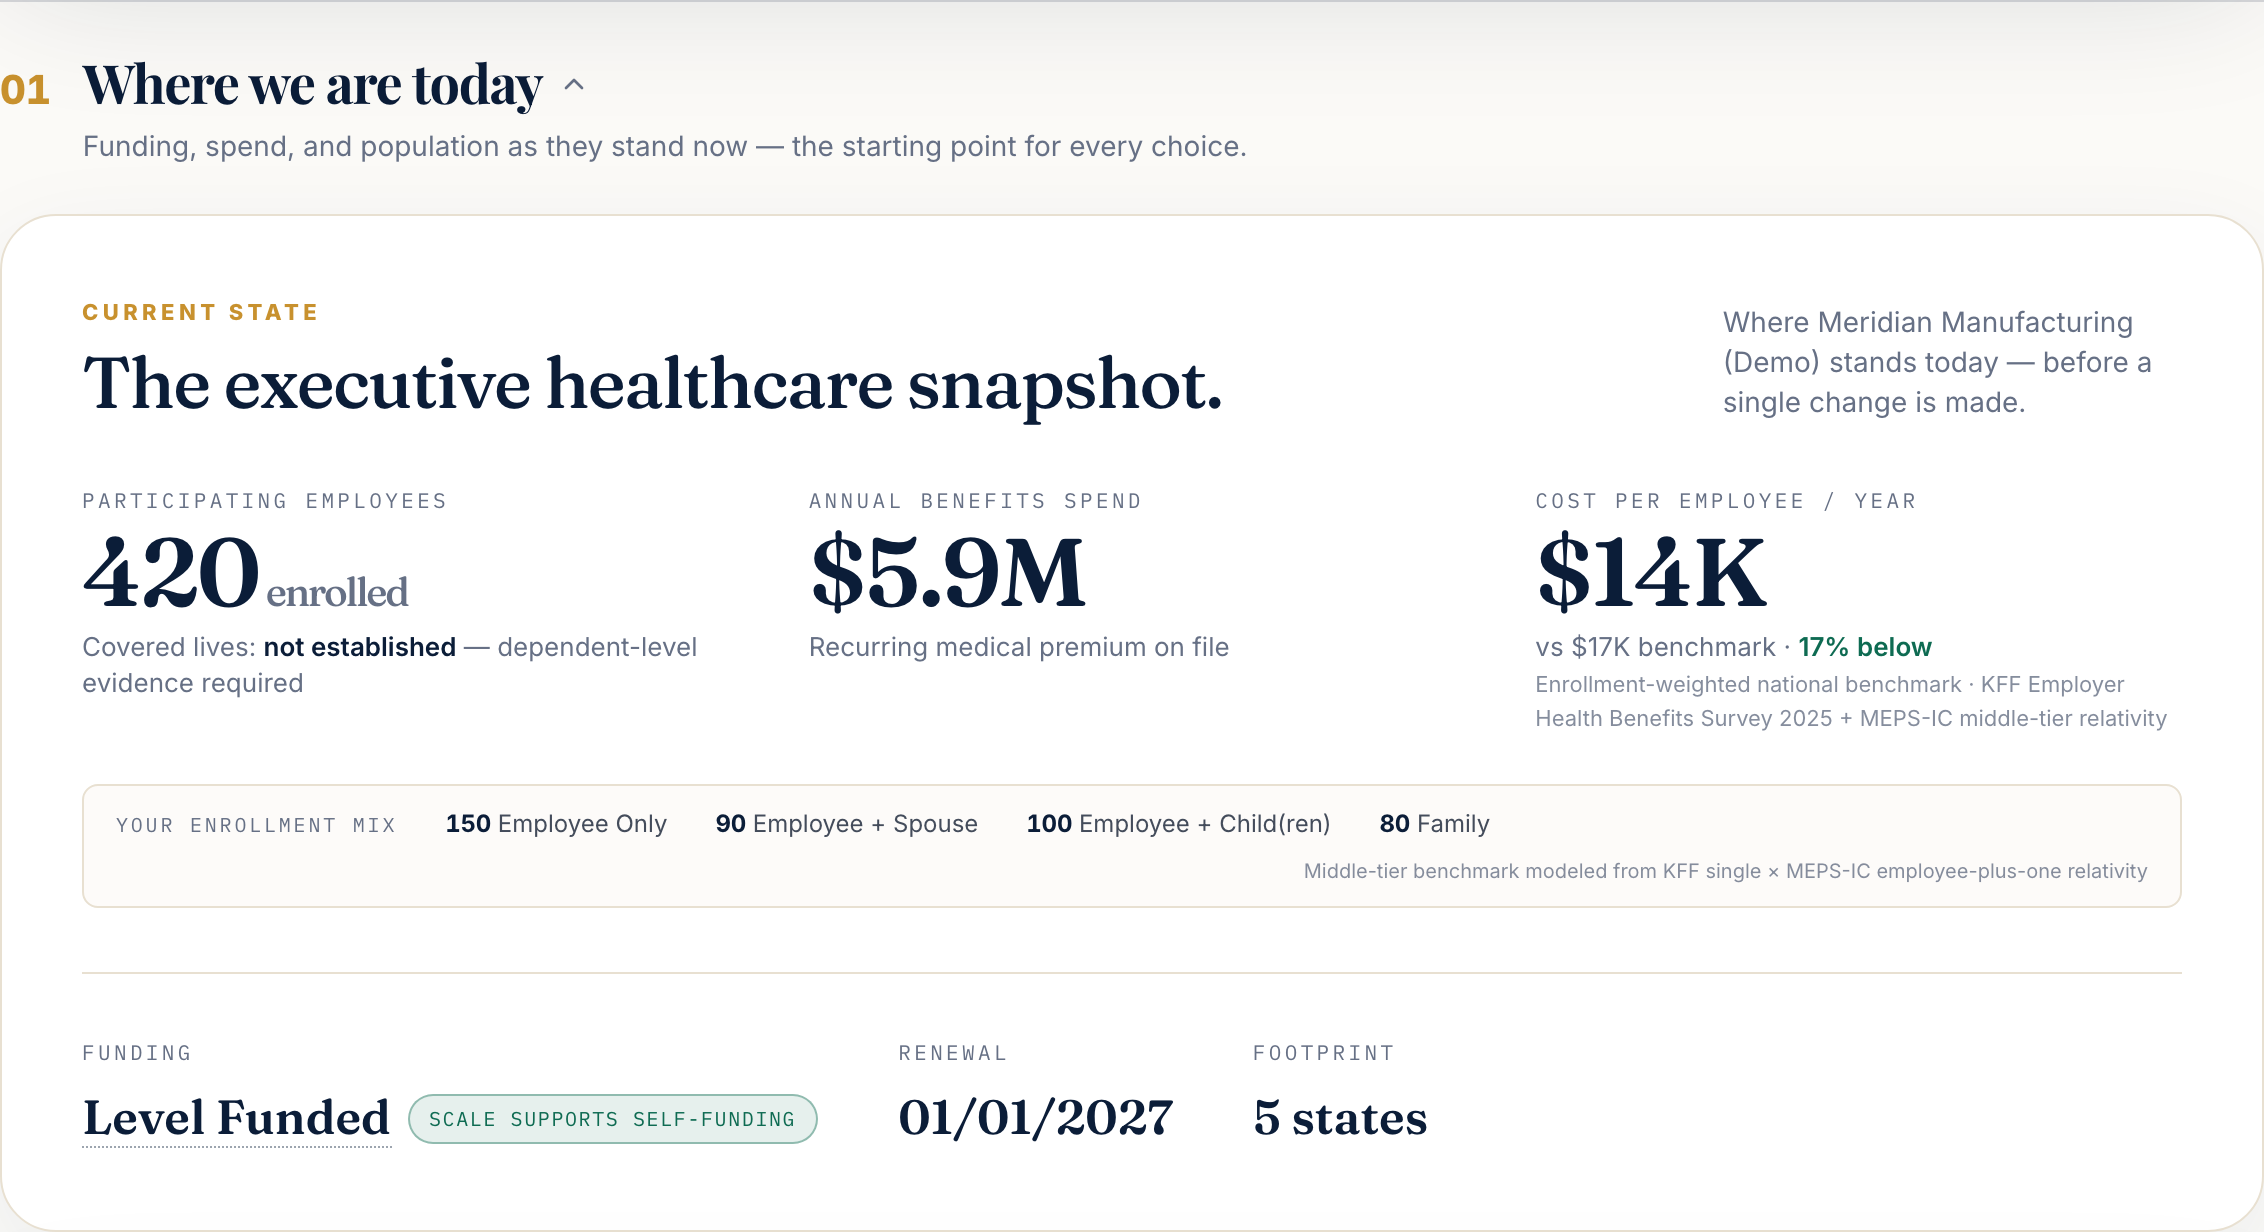
Swipe to read →
The scale of the decision
$5,900,000
Current annual spend
$14,048
Per employee, per year (PEPY)
$33,929,360
Cumulative spend over 5 years at this trend
Illustrative. This uses your inputs to show the scale of the decision — not a finding, a forecast, or a savings estimate. Your actual numbers require evidence and analysis. BenefitProof does not promise savings.
The asymmetry
Small cost to know. Large consequence to guess.
You’re examining a seven-figure decision. Establishing what the evidence actually supports costs a rounding error against it. That asymmetry is the whole point: the facts are inexpensive; deciding without them is not.
We don’t promise savings — we establish what’s real, so the decision is made on proof.
Independence
Independence & control
no broker change required to commission the analysis
you own your data and control who sees it
your advisor interprets, BenefitProof shows the work